Location Based Downtime Report
Standalone evidence to support Extension of Time, compensation and relevant event assessments under NEC and JCT. Compare monthly weather against 1‑in‑10 year thresholds and long‑term averages with clear anomaly signals.
- Purpose‑built for post‑event analysis and disputes
- Monthly value vs 1‑in‑10 and Long‑Term Average with anomaly assessment
- Daily breakdowns for rainfall, snowfall, temperature, wind and sunshine

Clear, defensible weather evidence for your project
We mirror the core logic used in location‑based downtime assessments — monthly vs 1‑in‑10 and long‑term averages — and include daily details for transparency.
Compare against 1‑in‑10 values (NEC) and Long‑Term Averages (JCT) to assess exceptional conditions.
World‑class datasets (ECMWF ERA‑5 / ERA‑5 Land) on a ~10×10 km grid, land and sea, provide robust conditions for any location worldwide.
Designed for claims, adjudication and audit. No planning‑tool export or import required.
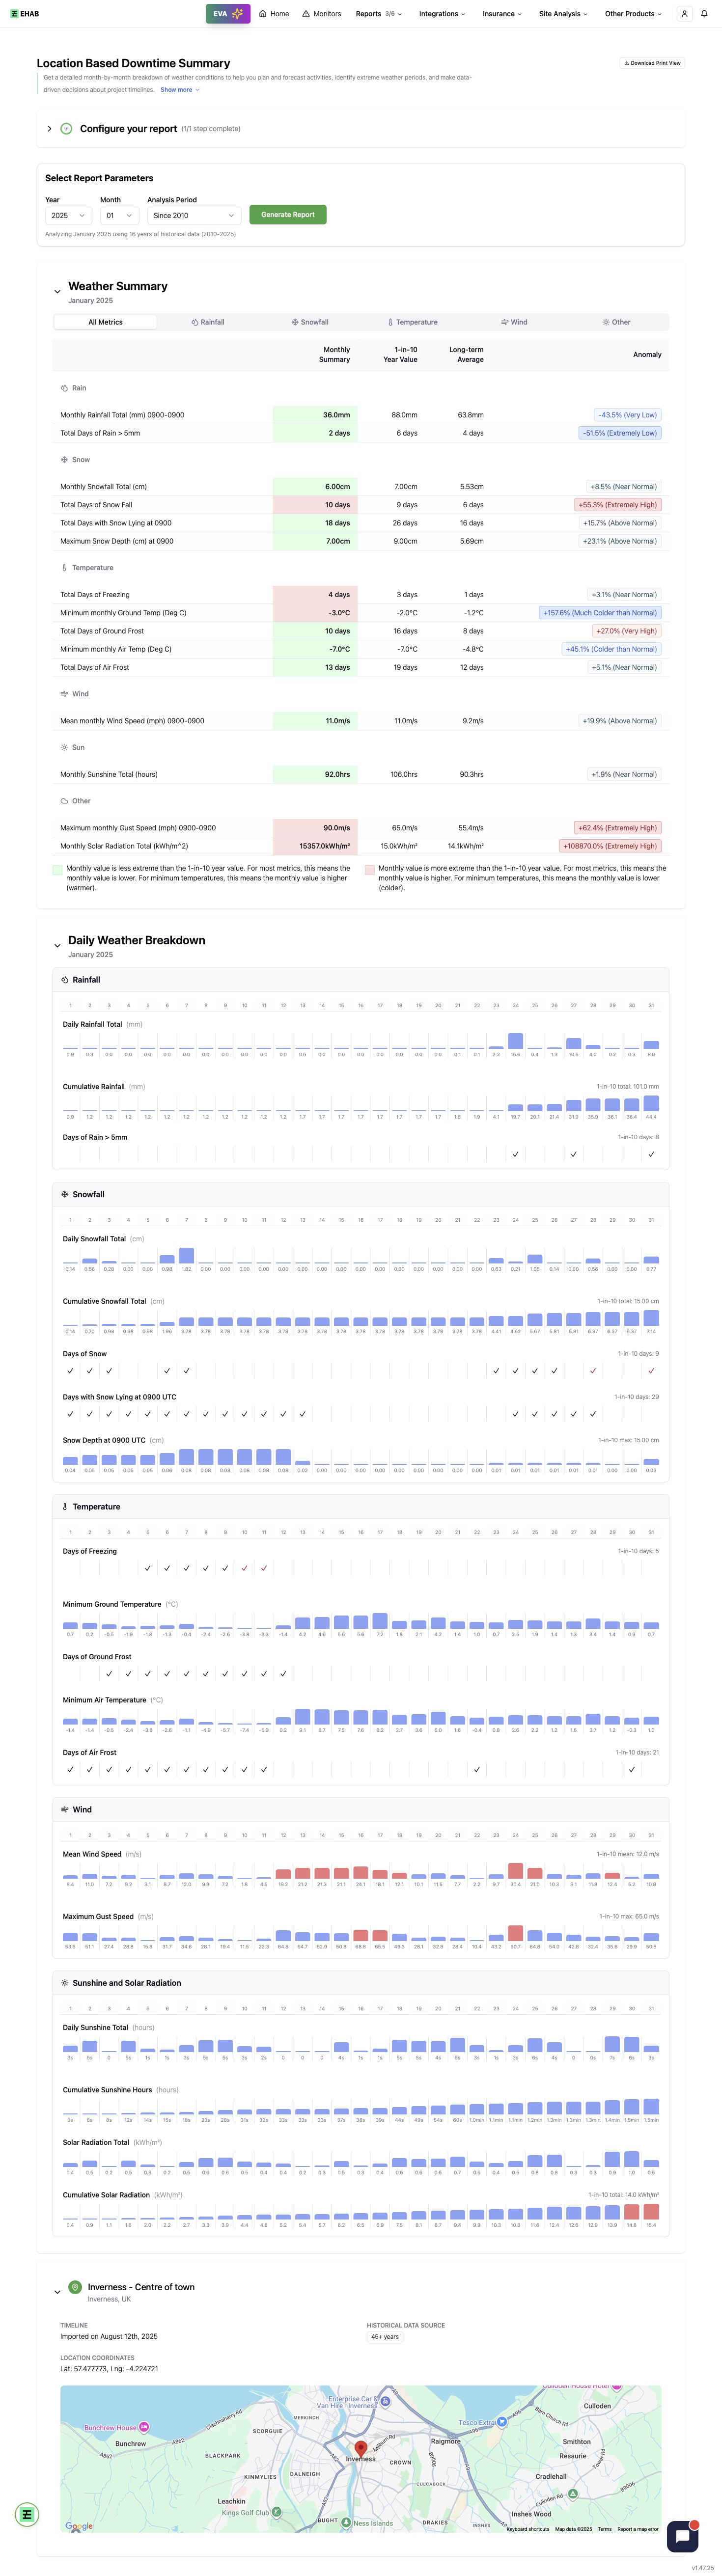
The report presents monthly summaries with anomalies and 1‑in‑10/LTA comparatives, followed by daily charts for rainfall, snowfall, temperature, wind and sunshine, and a map of the location.
- • Select a site and month(s) relevant to the claim period
- • Compare observed month vs 1‑in‑10 and LTA to determine exceptions
- • Use daily breakdowns to evidence specific days of impact
- • Attach report to EOT submissions, adjudication or negotiations
For Contractors & Planners (EOT)
Evidence unusually adverse weather against contract terms with monthly and daily clarity. Align stakeholders on facts and avoid subjective debates.
- ✓ Assess entitlement using 1‑in‑10 thresholds (NEC) and Long‑Term Averages (JCT)
- ✓ Daily records across 80+ variables (rain, frost, wind, sunshine, etc.) to pinpoint constraints by date
- ✓ Attach an authoritative PDF to delay notices and EOT submissions
- ✓ Global coverage on ~10×10 km grid (land & sea) — reliable anywhere you build
Contractors using detailed weather evidence see materially higher success rates in EOT claims. Stop relying on memory or site photos — bring statistical proof.
For Claims & Disputes Teams
Neutral, data‑driven evidence that de‑escalates conflict and accelerates fair outcomes.
- ✓ Objective comparatives that make entitlement straightforward, not subjective
- ✓ Daily timelines for causation: link specific non‑working days to weather
- ✓ Consistent format aligned to NEC/JCT expectations — easy to review
- ✓ Supports adjudication, arbitration and settlements with credible facts
Transparent evidence prevents costly disputes and preserves relationships. Everyone sees the same numbers.
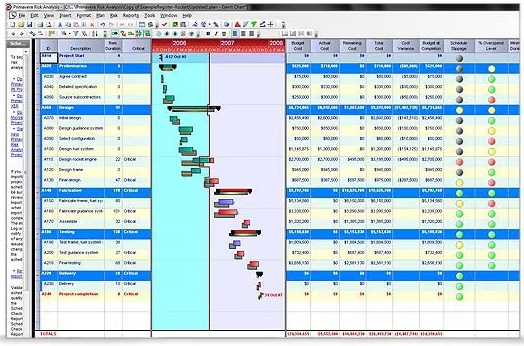
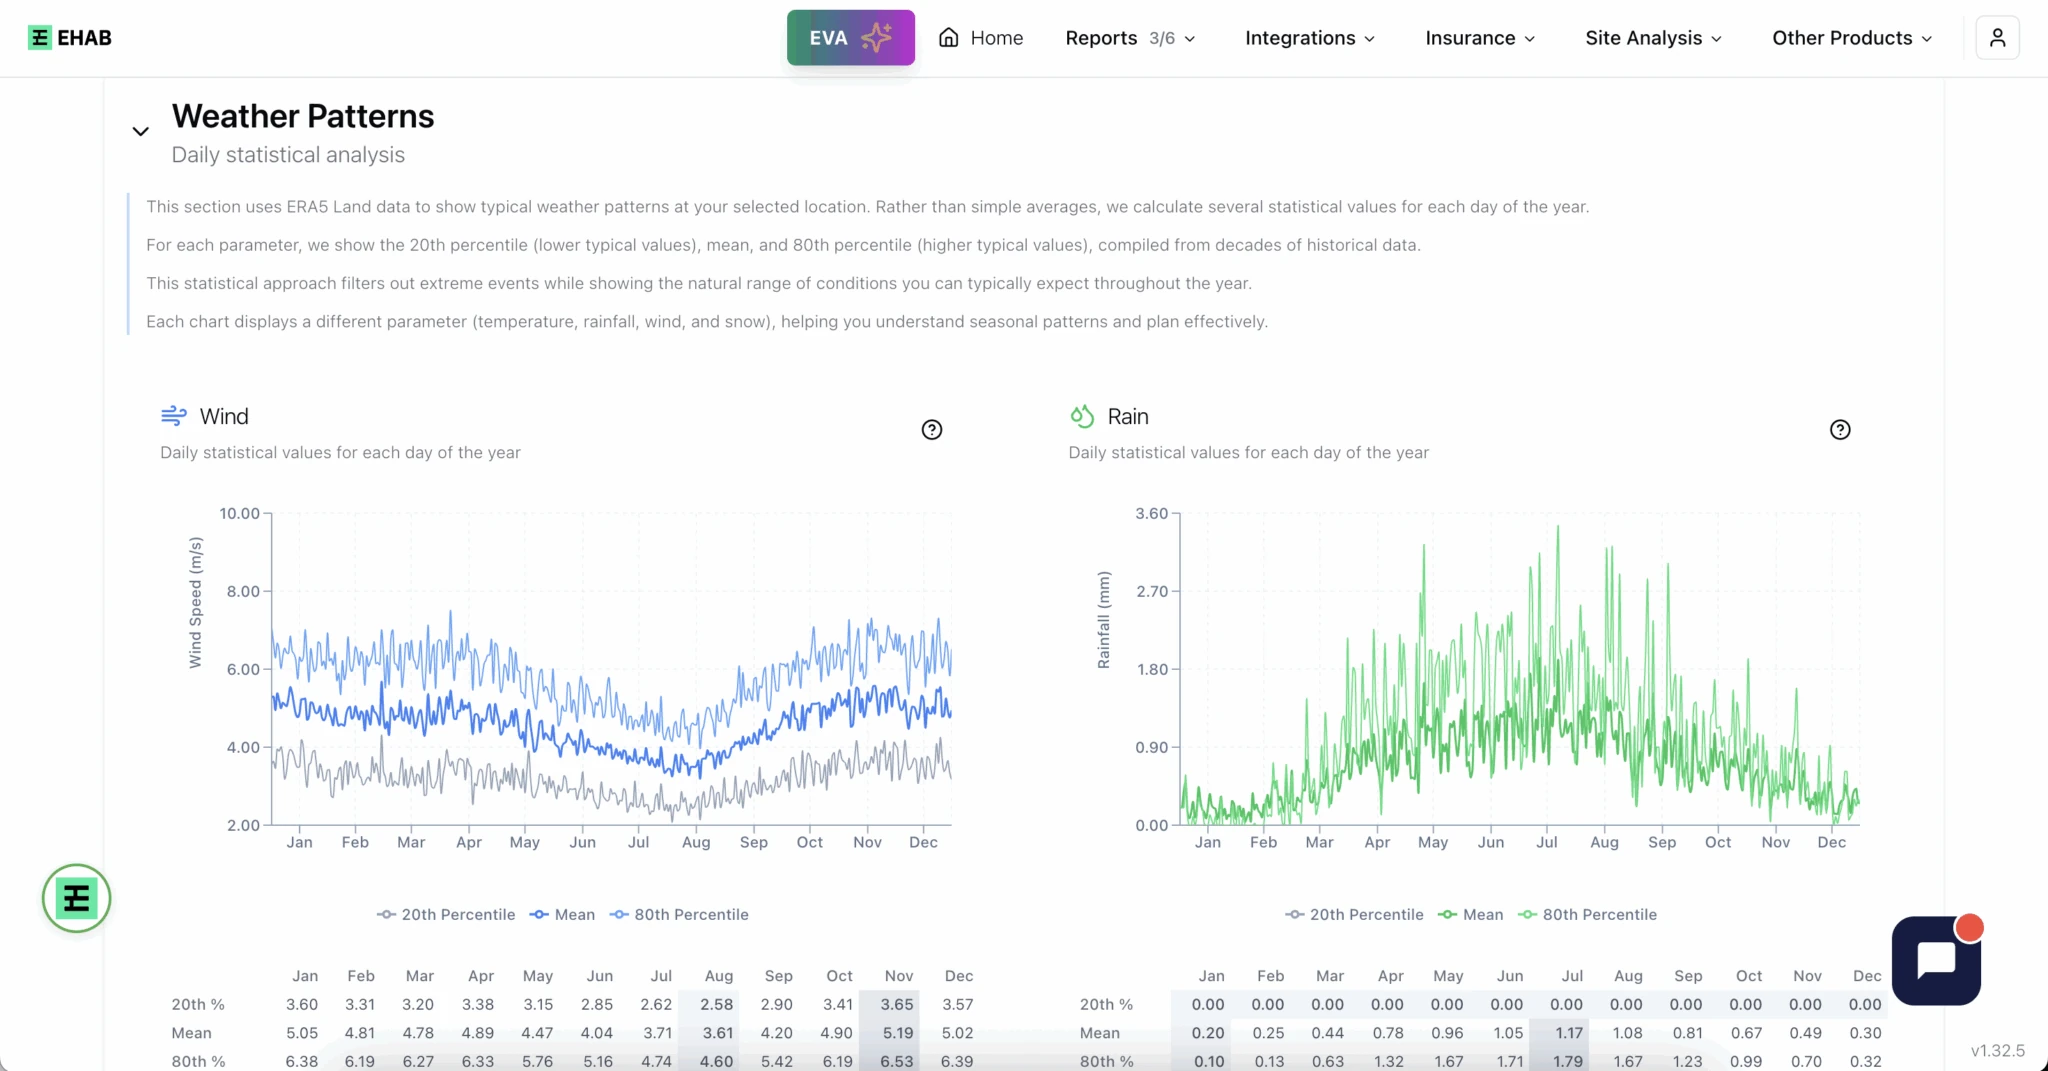
For Planners & Schedulers (Baseline & Tender)
Use multi‑decade climate statistics to set realistic weather allowances, choose start windows, and build evidence‑based programmes.
- ✓Baseline non‑working weather days by month for your site
- ✓Evidence‑backed TRA at bid stage; no guesswork
- ✓Seasonality: sequence weather‑sensitive works into better windows
- ✓What‑if comparisons for alternative start dates
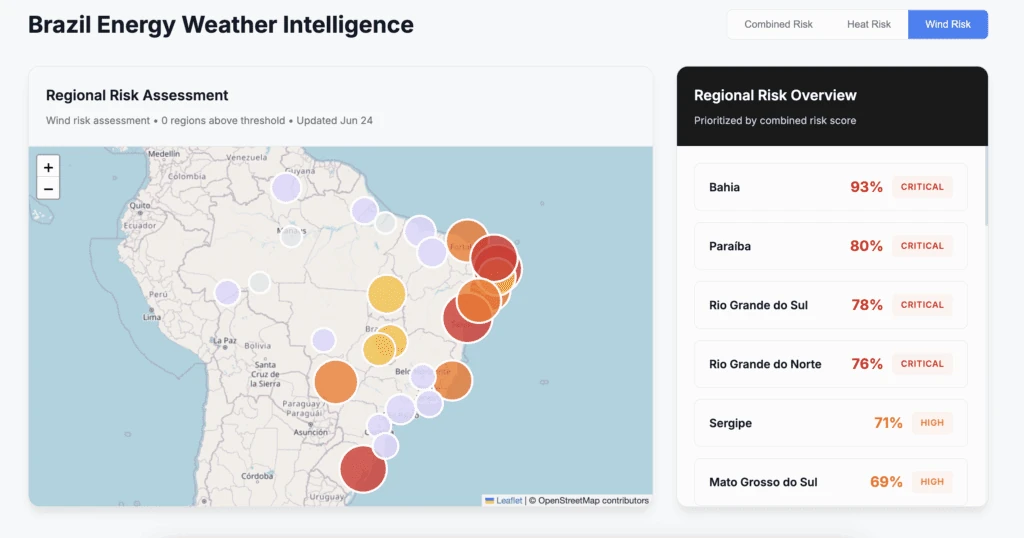
For Owners & Insurers (Risk & Contingency)
Quantify expected downtime and extremes to size contingencies, price risk, and document decisions with a clear audit trail.
- ✓Expected loss‑of‑working‑day ranges per season and site
- ✓Contingency and reserve sizing supported by history
- ✓Portfolio comparables and like‑for‑like benchmarking
- ✓Clear documentation for governance, audit and financing
Why our downtime reports
Built on authoritative data with a modern delivery experience.
- ✓Global ERA‑5 / ERA‑5 Land coverage — land & maritime
- ✓80+ weather variables; choose what matters for your works
- ✓Flexible baselines (10/20/30+ yrs) to reflect local standards
- ✓Instant delivery when thresholds are exceeded — never miss notice windows
- ✓Clear anomaly calls: Above/Below/Near normal at a glance
- ✓Daily detail for rainfall, snowfall, temperature, wind, sunshine
- ✓Audit‑ready PDFs; easy to attach to notices and claims
- ✓Backed by decades of observations and reanalysis science
Beyond construction
Any weather‑exposed operation can turn uncertainty into measurable, manageable risk.


What they say
“EHAB taps into weather data to provide consistent downtime analysis. It’s a prime example of new tech we’re using at BAM.”

“We use EHAB in QSRA sessions to model weather risk precisely, giving greater assurance on milestones and helping explore ways to de‑risk.”

“Integral to our risk management, enhancing accuracy, saving days of manual analysis, and letting us rehearse projects before work begins.”

Need a downtime report for specific months?
We’ll generate the monthly reports you need for your site and timeframe.
Latest from the blog
View all →What is a Location‑Based Downtime Report?▾
Which contracts/clauses does it support?▾
What parameters are included?▾
How are 1‑in‑10 and long‑term averages calculated?▾
How does this help with EOT claims?▾
Is coverage global?▾
How fast can I get a report?▾
What period does one report cover?▾
Can I use it for planning and tendering?▾
Do you integrate with my systems?▾
Which format do I receive?▾
Contact us
Want specific months or guidance on NEC/JCT language? Drop your details and we'll get back to you.